
Explore New York’s 230+ years of representatives*
In 237 years, New York has had 1,472 house representatives, and at it’s peak had 45 congressional districts. Find out how we got here, and how understanding our democracy in the past helps us understand the future.
*this section excludes the national senate as senators are elected statewide
1788
1st Congressional Delegation from New York
1842
Apportionment Act outlaws multi-member districts
1920
All New Yorkers age 21 or over can legally vote
1965
Voting rights act protects minorities
2014
Anti-Gerrymandering Amendment
1777-1841
The Birth of America sparked controversy in how the states handled representation. The early house of representatives was comparatively small, and congressmen were elected in differing ways, varying by state to state.
What does the constitution say about the election of representatives?
The majority of information the constitution gives on the makeup of the house of representatives stems from Article 1, Section 2, “The House of Representatives shall be composed of Members chosen every second Year by the People of the several States, and the Electors in each State shall have the Qualifications requisite for Electors of the most numerous Branch of the State Legislature.” This meant that house members must be elected democratically by the people, as opposed to the senate, and that the voters eligible to vote in house races would be the same as those allowed to vote in state legislative races. For example, blacks could not vote in state legislative races in 1788, so they could not vote for the house. Additionally, the constitution states “Representatives and direct Taxes shall be apportioned among the several States which may be included within this Union, according to their respective Numbers…” This established the procedure of apportionment in which representatives were assigned by population (at the time 3/5 of slaves were counted). Overtime, the constitution would ensure more people had the right to vote and be represented, notably in the 14th amendments equal protection clause. Additionally, the constitution notably never mentions elections via districts in Article 1.
Early Voting Rights

1777 State Constitution
Initially, the New York State Constitution only allowed for property owning males to vote, but notably didn’t restrict the right of black males to vote

1821 Constitutional Convention
In 1821, New York dropped it’s property requirement for white males, drastically expanding suffrage, though a provisions were added to disenfranchise black males

1829 Abolition of Slavery
Slavery was Abolished in New York, which would later set the groundwork for the underground railroad and expansion of the black electorate
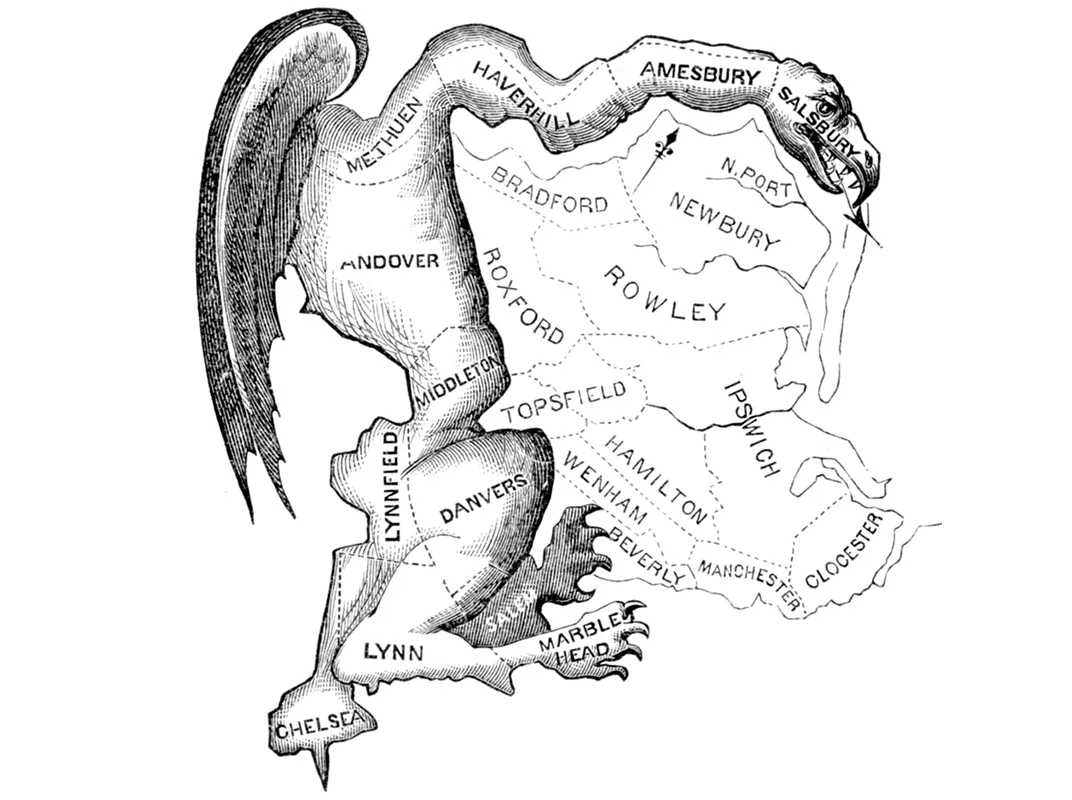
The Origin of Gerrymandering
In 1812, Massachusetts Governor Elbridge Gerry redrew state senate maps in order to favor his party the Democratic Republicans. This resulted in an awkward looking district in Essex county that resembled the shape of a salamander. The Boston Gazette would publish and forever coin the term “Gerry-Mander” after Governor Gerry and the Salamander shaped district.
Congressional Progression
New York’s electorate changed drastically in the years after independence, becoming the largest and most ethnically diverse in the nation. However representation under the constitution was in its early stages, and precedents on fair maps were nearly nonexistent along with heavy voter restrictions.
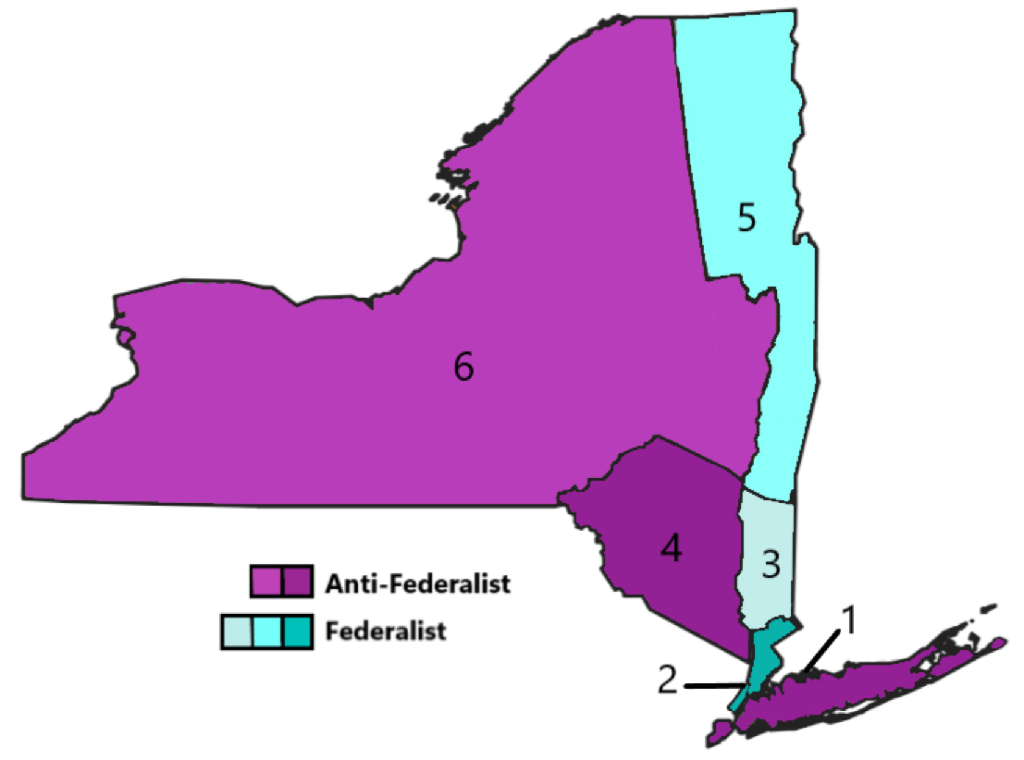

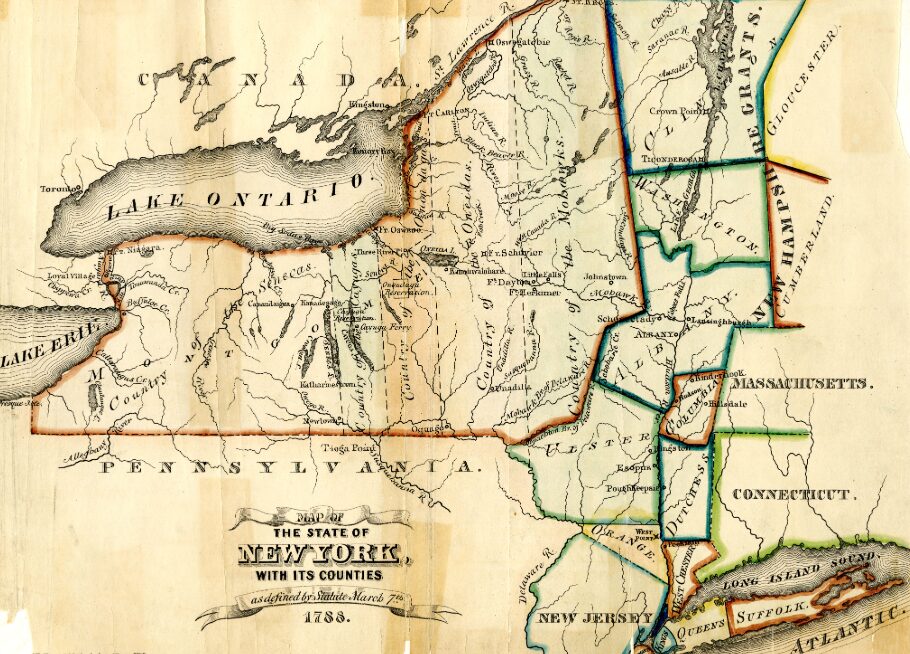
New York’s first congressional map (1789)
New York was initially allotted six congressional districts from the constitution with roughly 56,000 people per district.

Birth of political parties
The passing of the US Constitution divided members of congress for the first time into two official parties, before this, candidates ran individually and gerrymandering would be impossible due to no constant partisan electorate.

A Gerrymander before Gerry?
While New York’s representation after the election was proportional to its partisan popular vote (54% federalist), others states attempted creating districts to unseat political opponents such as in Virginia. Many Federalist states at the time elected a slate of candidates from the entire state in avoiding the district system, which naturally lessens minority representation.
New York’s first redistricting cycle (1792)
New York gained 4 seats as the total amount of representatives nationally increased from 69 to 105. (This was far before the hard cap of 435 representatives).

First Census
The first census was conducted by officials who would go door to door asking six questions about the number of free males, females and enslaved people in the household.
Disconnected Districts
Early mapmakers often created non-contiguous districts such as districts three and eight in New York oftentimes for partisan reasons.
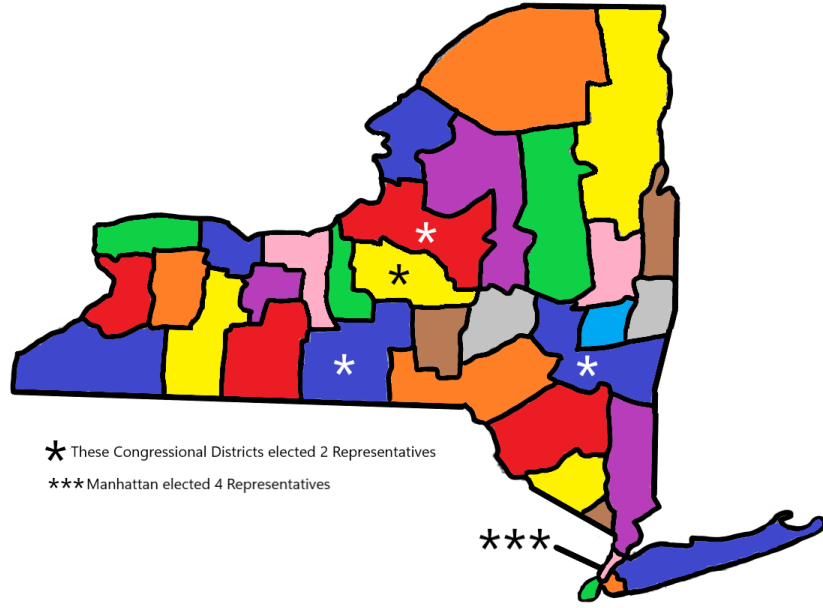
A 40 Seat Delegation (1842)
The 1832-1842 Map was the final map before the 1842 Apportionment act, at this time 17% of all house representatives were from New York, the most in history.

Property Requirements abolished
All White males could now vote in New York starting in 1821, vastly increasing the electorate. Free Black Males could also vote with heavy limitations.
Multi-Member Districts
A few of New York’s districts were represented by multiple people as seen on the map. Manhattan elected 4 representatives at large as at the time there was hesitancy of county splitting due to issues with ensuring equal population numbers and getting precinct polling locations.
The Apportionment Act of 1842
In response to states electing their representatives through different and often unrepresentative means, congress took action to create the modern single-member district system used today. Multi-member at at-large* multi-member districts were outlawed and all districts had to be contiguous.
*(At-large still used for states who don’t meet the population threshold for a 2nd congressional district)

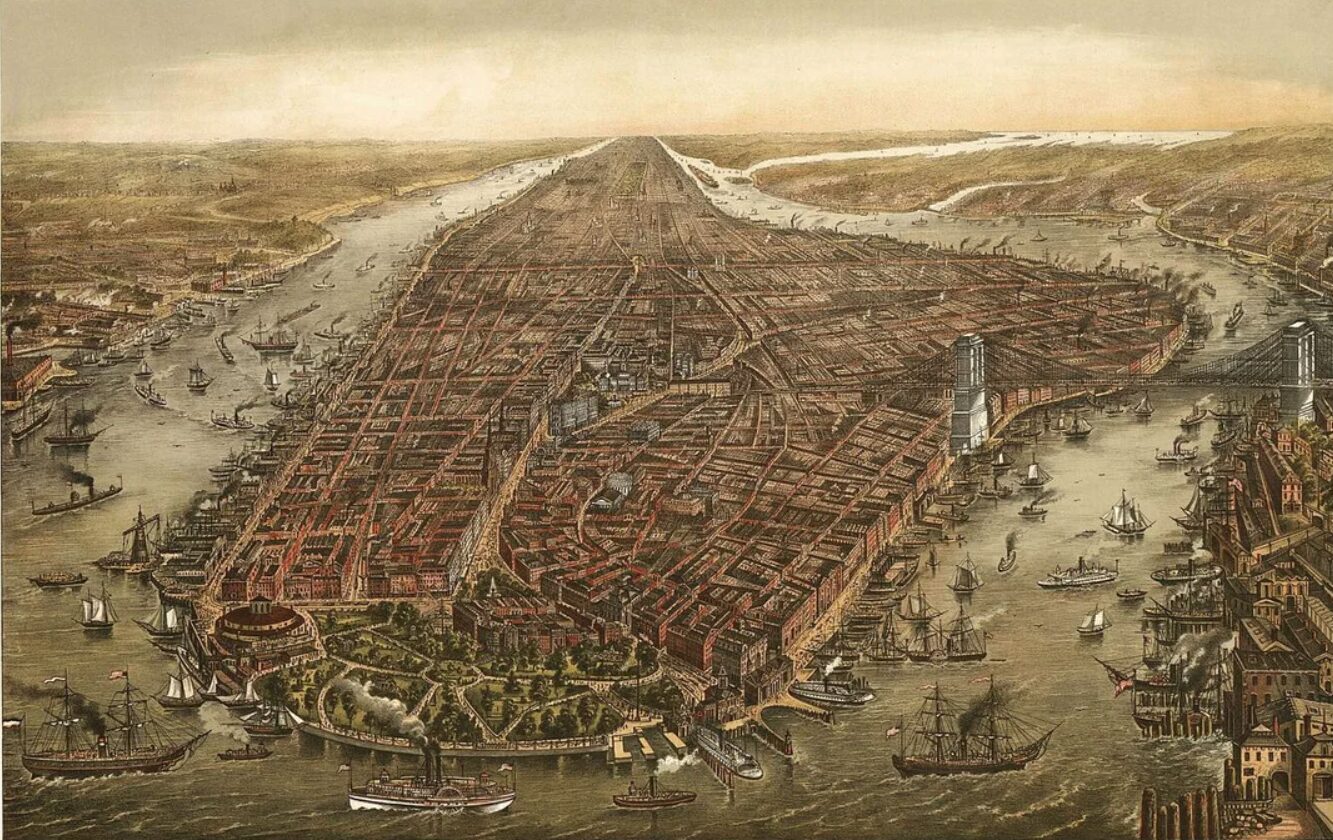
The Manhattan Example
For many years Manhattan would elect four representatives at large instead if splitting itself into four districts as politicians feared it would give representation to increasing minority communities such as the Irish.
1842-1919
The American electorate was increasing rapidly and was more diverse than ever. The 14th amendment’s equal protection clause paved way for arguments against gerrymandering and conversations on racial representation in mapping increased.
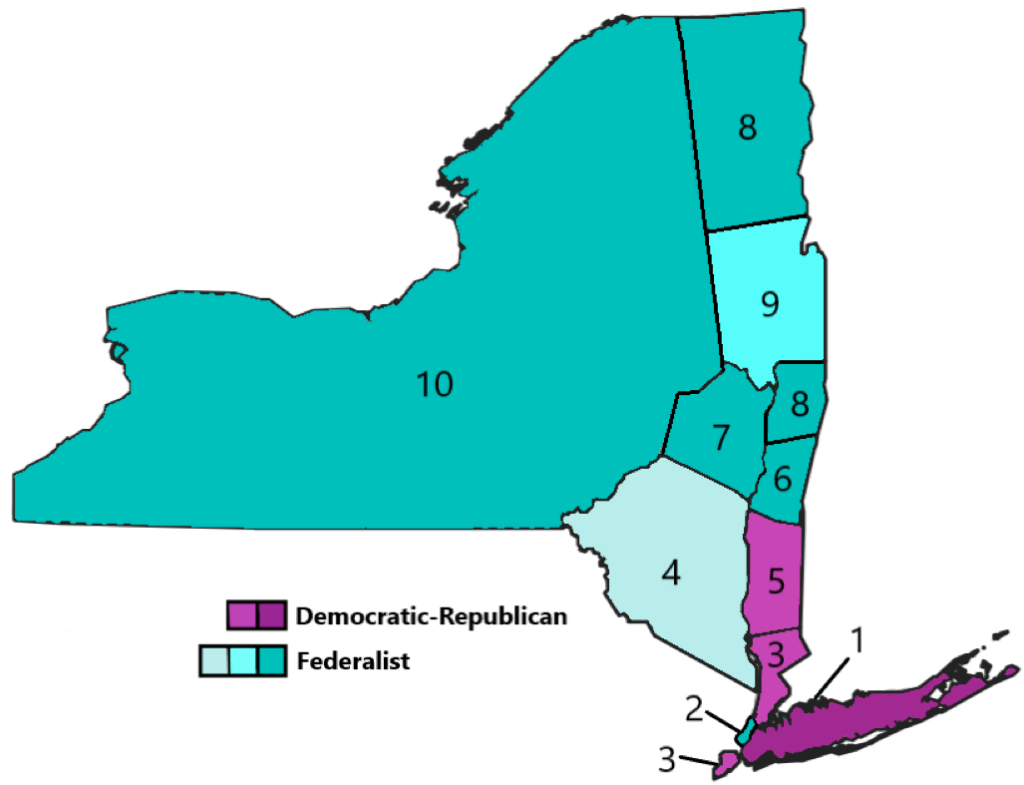
An Emerging New Two Party System
After the 1856 Election it was clear a new party system was emerging that came to cement the Democrat vs Republican axis we are familiar with today. After the Whig party collapsed due to inner factions disagreements over the 1854 Kansas-Nebraska act, Republicans became the anti-slavery pro-federal government party while the Democrats became the pro-slavery pro-states rights party. This cemented strong democratic constituencies in the south and republican constituencies in the north. States were also obliged to comply with the Apportionment Act of 1842 as parties could no longer dominate an entire states delegation via at-large party slate voting, this compelled more states to start gerrymandering under the single-district system.
1856 House Election Results (Republicans in Red, Democrats in Blue, Purple as Know Nothing)
“1856 U.S. House election results.” Map by Incognito melon, Wikimedia Commons (CC BY-SA 4.0)
Outcomes of the Civil War
14th Amendment
After the 13th amendment was signed officially banning slavery, the 14th amendment was passed in 1868 guaranteeing birthright citizenship and “equal protection of the laws” for said citizens. This would be the catalyst for ensuring equal populations per district on the federal level, and would justify VRA protection of minority districts in the 1960s.
15th Amendment
Passed in 1870, the 15th amendment prohibited states from denying ones right to vote based on race. Effectively this meant all men could vote. However Jim Crow era discouragement of voting for African Americans proved pervasive in the South, and a general lack of education also stifled turnout of most minorities nationally.
Polarized and Consistent Voters
Gerrymandering is easiest when demographics of voters stay consistent and polarized so they can be more easily manipulated. This was the case in the Gilded Age (1870s-1900s) when middle and upper class Northerners and African Americans primarily composed the Republican party, with White Southerners and working class city dwellers composed the Democratic party.
Partisan voting consistency makes gerrymandering easier because voters reliably support one party and don’t swing easily making it easier for mapmakers to maximize perfect ratios of Republican versus Democratic voters. Gerrymandering would be easiest if you could set every district to be 50.01% in favor of your party and have zero swing, that way you could maximize the most value of your votes, but swing is always present, making said example unrealistic.
For these reasons, the Gilded Age is highly politically similar to our own.
1885 New York Gubernatorial Election (Republicans in Red, Democrats in Blue)
“1885 New York gubernatorial election results map by county.” Map by ZackCarns, Wikimedia Commons (CC0 1.0)
“No Data, No Problem”
Unlike today, politicians in the 19th century did not have advanced partisan and data analytics to see which precincts vote for what party and by what margin. Instead they would estimate populations or strategically not redistrict over long periods of time to disenfranchise up and coming electorates. This led to situations where some congressional districts had wildly different populations then others despite each district having equal representation. Typically this led to urban centers being disenfranchised as their growth was not accounted for, along with weariness on splitting counties.
New Voters

The Female Vote
With the 19th amendment ratified in 1920, the voting base of America drastically expanded. This would later set the groundwork for female representation in congress, however this would not drastically alter the partisan composition of America.
At the turn on the 20th century, the Women’s suffrage movement became more prevalent, and large waves of immigrants came to America, some lending their votes to political machines.

New Immigrants
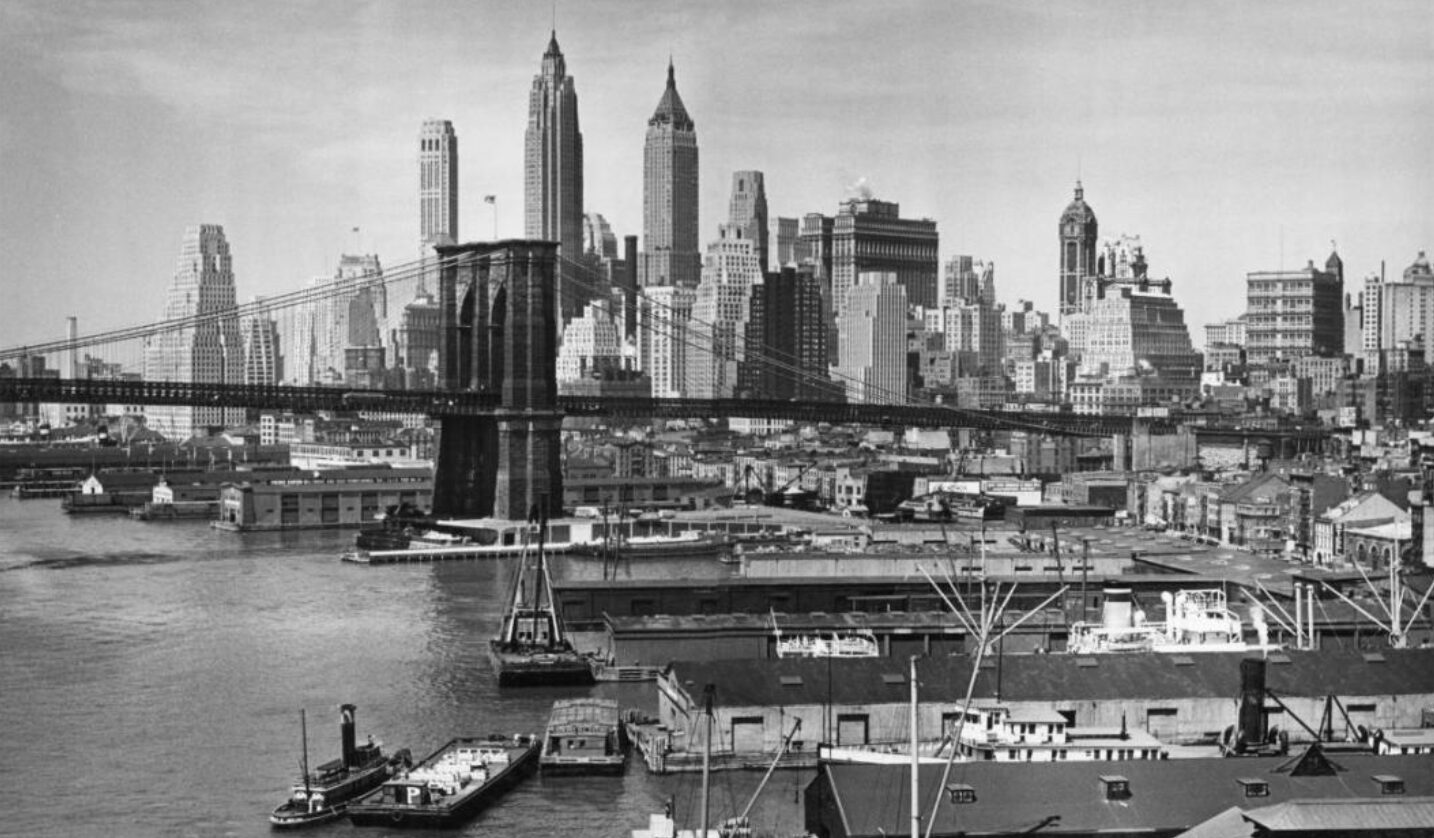
Around 20-27 million immigrants came to America from 1890-1920. Most were from Southern and Eastern Europe and were largely Catholic. They primarily flocked to urban centers such as New York City, Philadelphia, Boston, and San Francisco, this stirred paranoia about their representation and corruption.
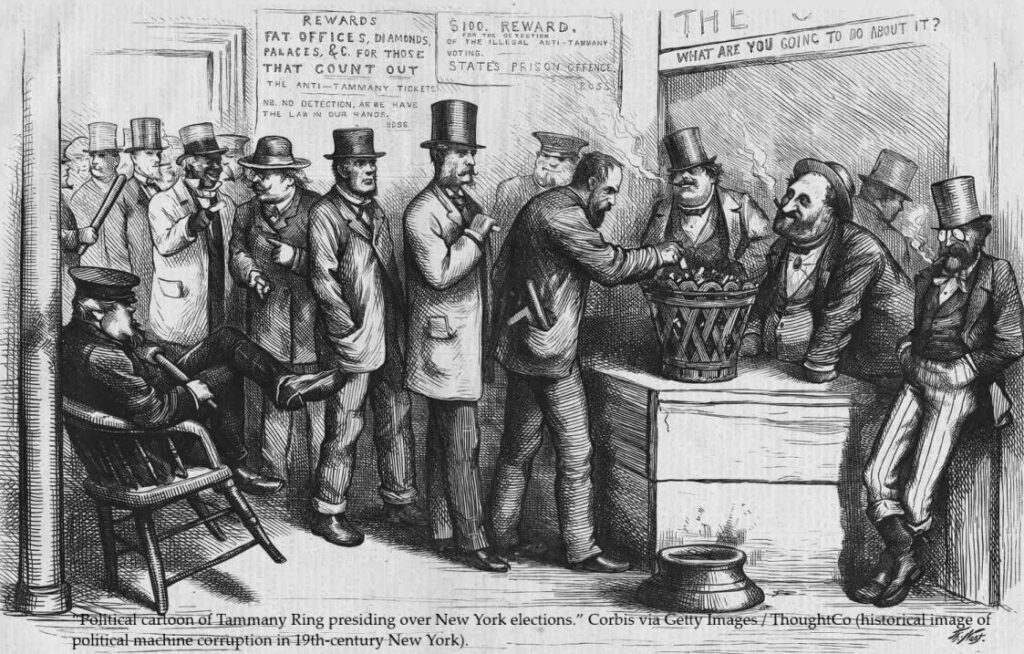
Tammany Hall
In the growing urban center of New York City Tammany Hall operated by giving services to immigrants in exchange for votes, perpetuating a cycle of patronage that dominated elections in the region in the late 1800s.

Consequences for Representation
Not only did this create a legacy of corruption of city, it contributed to stigmas around increasing ethnic urban populations of Catholics, many of which were impoverished. Members of the house worried that as the body expanded, representatives from NYC and other urban centers could be controlled by said corruption.
1920-1969
After capping the amount of representatives in the house and the 19th amendment granting the right to vote to women, representation became often intertwined with racial justice in a struggle to standardize redistricting under the principles of “one person, one vote”.
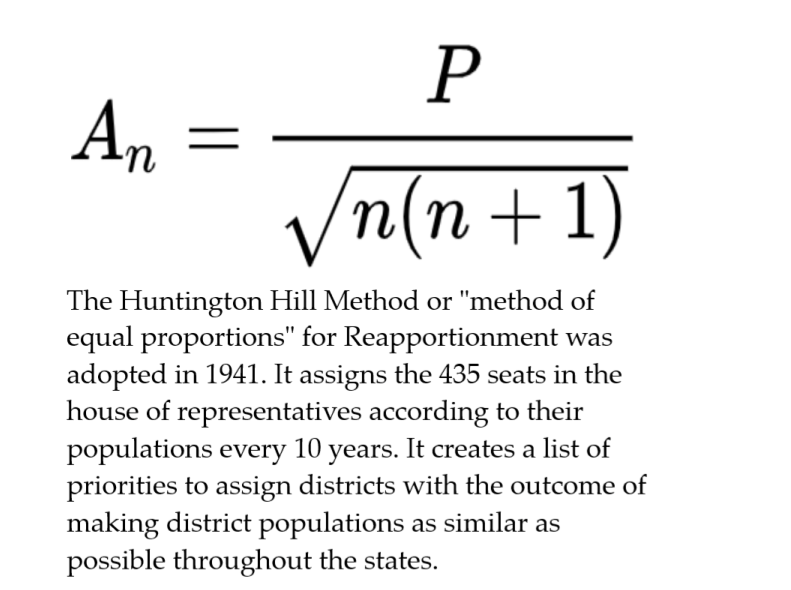
The Capping of the House
The Permanent Apportionment Act of 1929 capped the House of Representatives at 435, before then, the house would grow by an arbitrarily specified amount of seats after each census (10 year cycle). This was done due to debates over urban vs rural representation with increasing populations of urban immigrants, but also largely a concern that the house was growing so large that it could not be effectively managed.
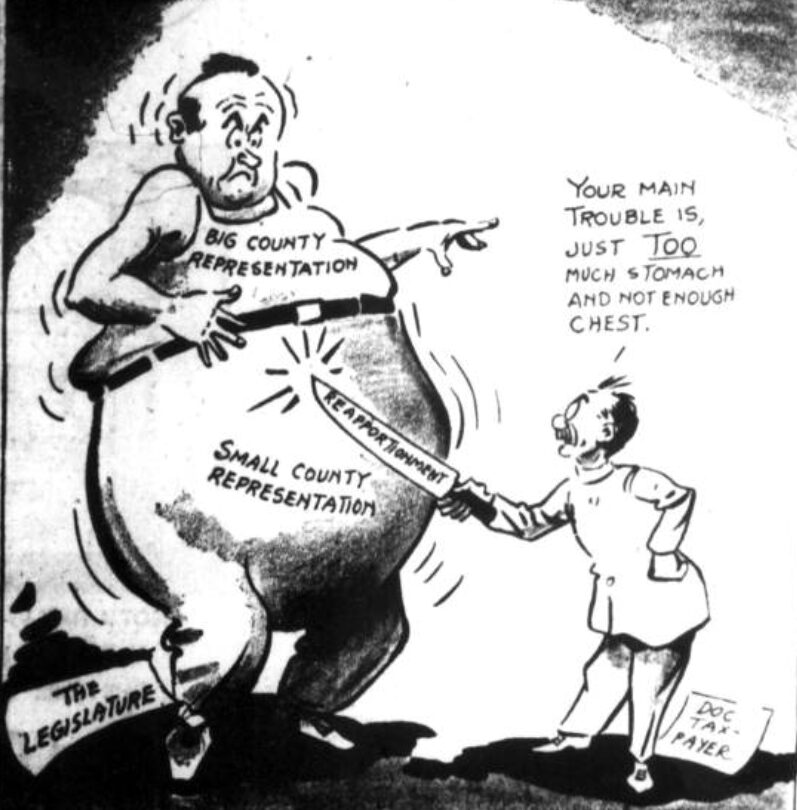
Malapportionment from lack of Redistricting
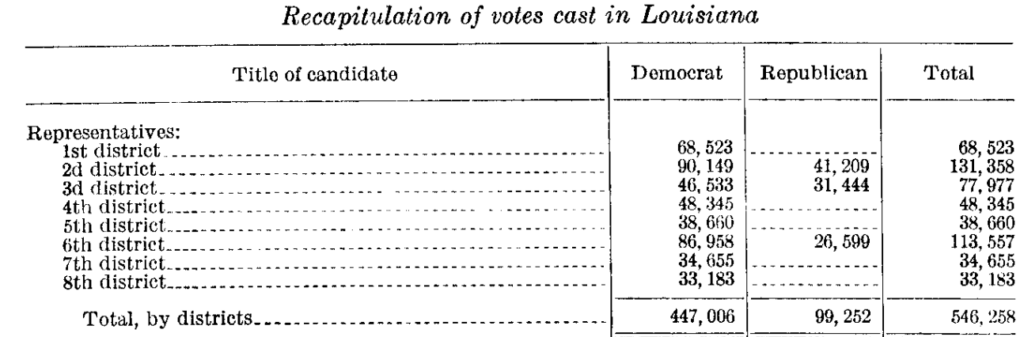
Overtime, some states district lines became stable due to states not being awarded or detracted a seat. In response, some states would not redistrict at all for long periods of time. However this would create large population disparities due to increasing urbanization and population growth, Some states such as Connecticut and Louisiana would not redistrict for half a century, Connecticut (1912-1962), Louisiana (1912-1966).
Lopsided populations:1966 House Elections in Louisiana (~33,000 vs ~131,000 votes)
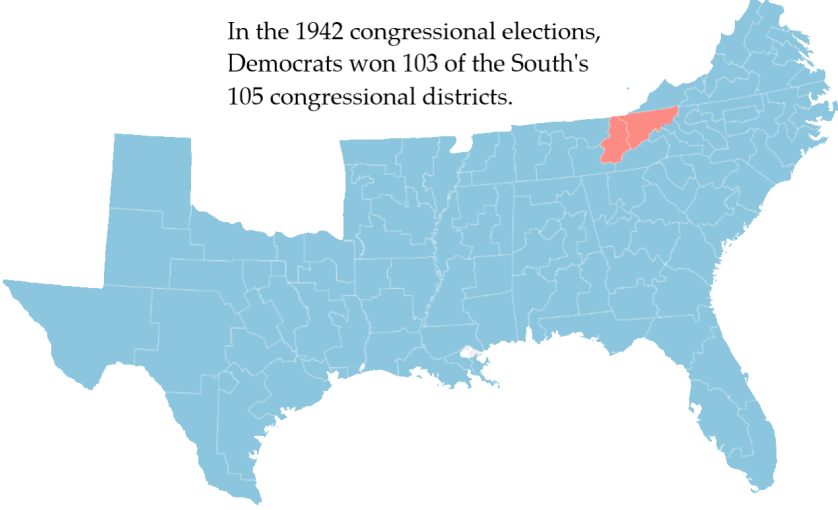
Democrat Control of the South
Maps in the south often disenfranchised Black voters due to cracking their populations between different districts, in the pre VRA era, this was legal and many southern states which were Democrat controlled benefitted from denying African American representation, which at the time typically voted Republican.
Redistricting Supreme Court Cases of the 60s

Baker vs Carr (1962)
The Supreme court ruled six to three that Tennessee violated the 14th amendments equal protection clause due to not redistricting its local state districts for decades leading to malapportionment. This landmark case set the precedent that the Supreme Court could weigh in on redistricting matters.
Reynolds vs Sims (1964)
In a case where Alabama assigned a state representative per county, one district had 41 times the constituents of another. Like Baker vs Carr, the court ruled eight to one that Alabama had violated the equal protection clause of the 14th amendment. The court determined that representative districts across America should have as equal population as “practicable”.
Wesberry vs Sanders (1964)
Georgia’s congressional map included an Atlanta district that had twice the population of surrounding districts. One Atlanta district resident, James Wesberry, argued that since his vote effectively mattered as half a vote compared with other Georgia residents, he was deprived of his right to vote. The court ruled six to three that Georgia had not just violated the 14th amendment but also Article 1, Section 2 of the constitution.
The Voting Rights Act
Passed in 1965, the VRA assures voting rights protections for minorities. Section 2 in particular protects minority voting rights in all aspects of an election procedures, more specifically it mandates the creation of minority minority districts, essentially protecting minority constituents from being diluted or “cracked” between districts where they are significant in proportion and live in a cohesive area. Note that packing minorities does not necessarily mean racial Gerrymandering, rather trying to consolidate minority populations to ensure they are the majority in a district, hence a “majority-minority” district
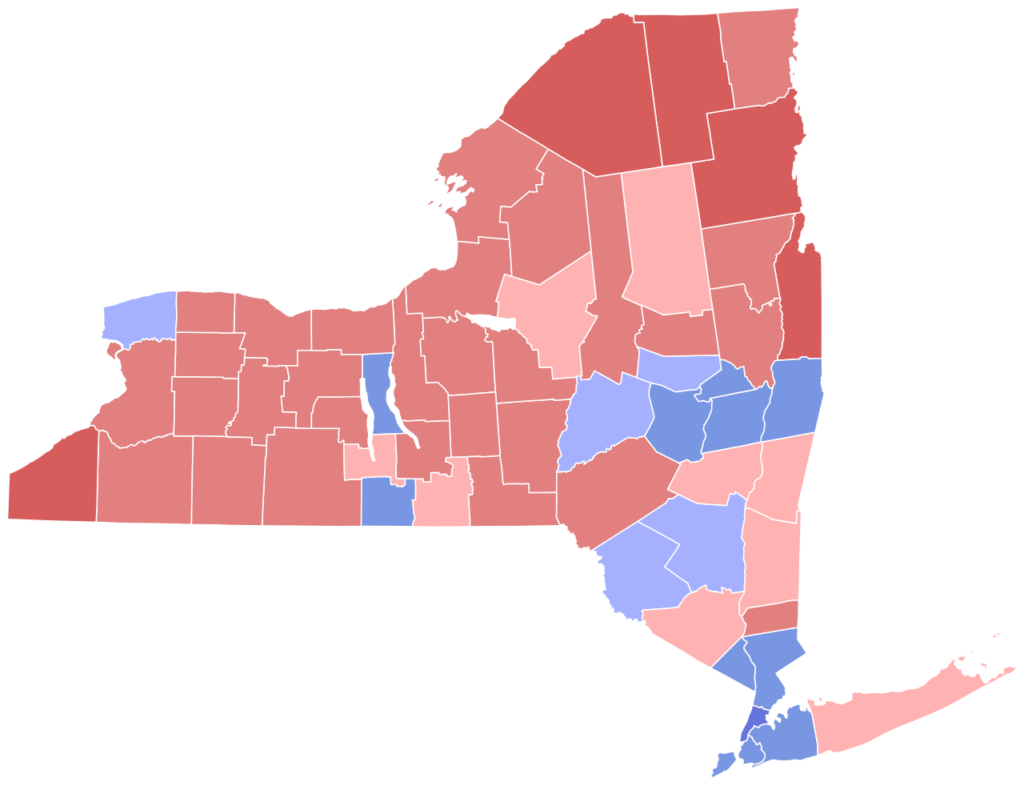
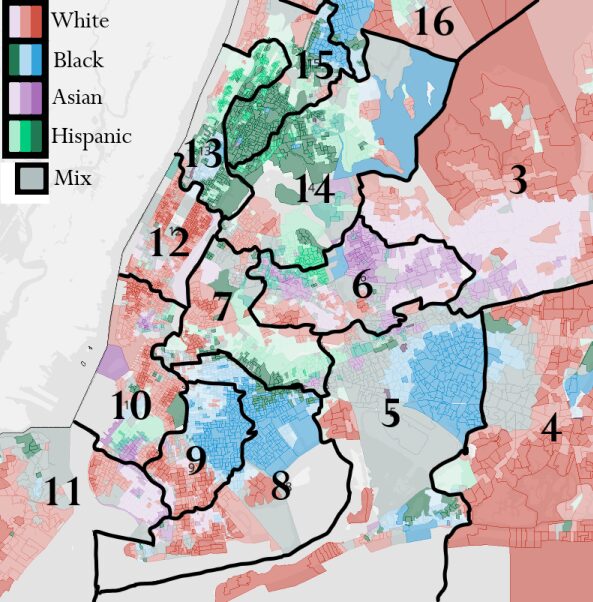
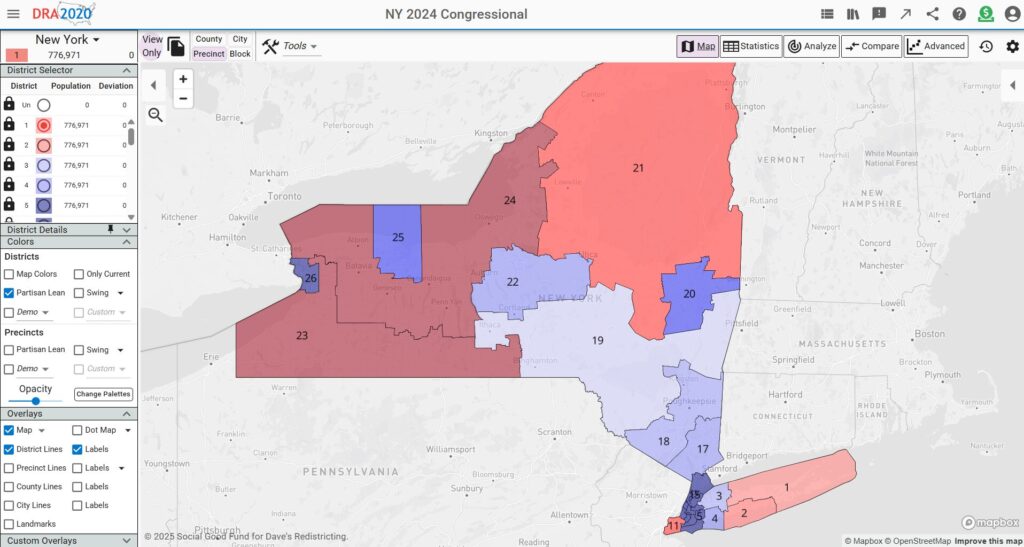
New York City 2024 Congressional Map with Racial Data, (Lines often reflect racial groups to ensure representation)
1970-2019
Redistricting had largely been standardized and was beholden to VRA regulations protecting minorities. Overtime party loyalties would become more entrenched and better technology would allow for more accurate gerrymanders nationwide.
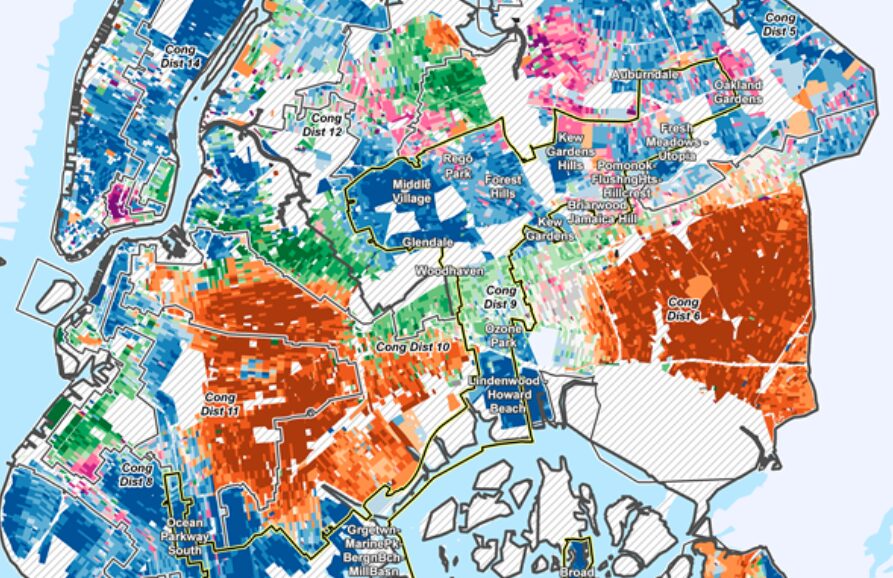
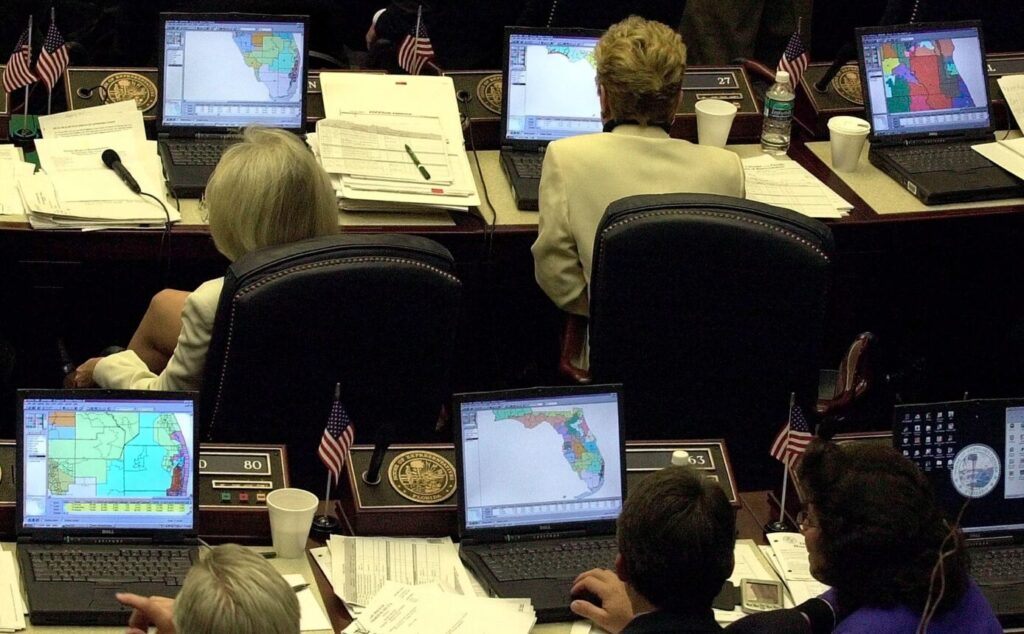
A New Era of Data
The late twentieth century brought extensive advancements in election/data record keeping down to the precinct level. Digital partisan analytics meant mapmakers could more easily target partisan and racial demographics. This would lead to more sophisticated and “ugly” looking gerrymanders that sought to maximize vote share as said vote share was more readily viewable through computers. However, in the right hands, this data could be used to make proportional and representative maps.
“Modern technology electoral map illustration.” Illustration by Guardian Design, The Guardian (used under fair use) 2021
Pro Incumbent Maps
Before polarization kicked in around the turn of the century, both parties often cooperated to make maps that prioritized incumbency, not necessarily a certain party. To this day bipartisan agreements over redistricting can be reached when within the state the majority party respects certain representatives from the other party (often powerful or heavily tenured), therefore keeping their districts intact. A modern example of this is when New York lost a congressional district after the 2020 Census. Longtime house member Chris Collins from New York’s 27 congressional district resigned after facing insider trading charges in 2019. For the following redistricting cycle, the retiring of a longtime incumbent freed up mapmakers to eliminate his district, splitting it in four.*
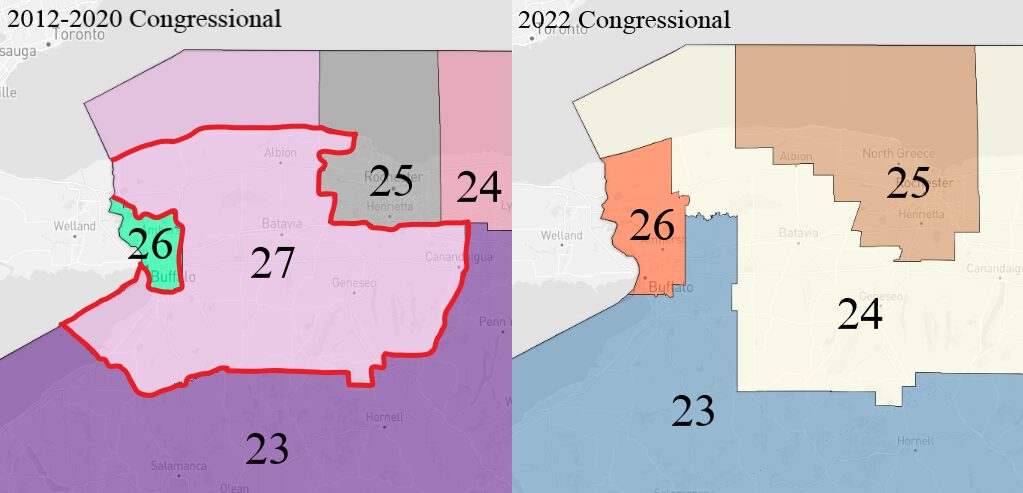
*The elimination of the district was also due to it being geographically easy
Modern Escalations
By the 2000s more states such as Texas, Ohio, North Carolina, and Pennsylvania had established elaborate gerrymanders, with digitized mapping, partisan data and polarization making results more reliable. After the 2008 presidential election where Democrats carried the house 257-178, Some Republican state parties got additional assistance from National Republicans to win over state legislatures for the purpose of controlling redistricting in 2012 in a project called REDMAP.* The result in 2012 is that Republicans were able to hold a 234-201 majority of the house despite losing the national popular vote. (Some Democratic states like Maryland and Illinois also passed gerrymandered maps over this cycle.) Major litigations came out of the 2012 redistricting cycle, such as Rucho vs Common Cause in North Carolina and Gill v. Whitford in Wisconsin.
Recent Court Cases on Gerrymandering
Davis v. Bandemer (1986)
In Davis vs Bandemer The Supreme Court ruled that partisan gerrymandering claims can be determined by the Equal Protection Clause. However, the Court set an extremely high standard for proving a violation, requiring evidence of intentional discrimination and negative long term effects. As a result, the Indiana redistricting plan in question was upheld, and the decision made successful challenges to partisan gerrymandering very difficult for decades.
Shaw vs Reno (1995)
Shaw v. Reno addressed racial gerrymandering determining that redistricting plans that create bizarrely shaped districts primarily to separate voters by race can violate the Equal Protection Clause of the Fourteenth Amendment. Even when the goal is to increase minority representation, race cannot be the dominant factor unless the plan passes strict scrutiny. The decision established that voters may challenge racial gerrymanders and set limits on the use of race in drawing electoral districts.
Arizona State Legislature v. Arizona Independent Redistricting Commission (2015)
Arizona State Legislature v. Arizona IRC addressed whether a state could remove congressional redistricting power from its legislature and give it to an independent commission. The U.S. Supreme Court ruled that Arizona voters acted constitutionally when they created the Independent Redistricting Commission through a ballot initiative. As a result, the decision upheld the use of independent commissions to reduce partisan gerrymandering.
New Independent Redistricting Commissions
From the 2000s to 2010s many states embraced independent redistricting commissions (IRCs) as feasible and neutral alternatives to increasingly effective partisan gerrymandering by the part of state legislatures. Here are a few examples.

Arizona (2000)
Arizona voters passed Proposition 106, a ballot initiative that took congressional redistricting power away from the state legislature and gave it to the Arizona IRC, it was one of the earliest states to adopt a commission and was a leader throughout the United States in establishing IRCs
California (2008)
California’s IRC was created by voter approved ballot initiatives in 2008 and 2010. While IRC maps have been put on hold recently for the 2026 midterms, regardless, California as the state with the largest population made a meaningful national impact with its electoral fairness as a highly partisan state.
Michigan (2018)
Michigan established its IRC after 2018-ballot initiatives, a big step in a state that has had a history of gerrymandering. In a highly contested competitive state, their congressional delegation matches their electorate relatively fairly.
New York’s Independent Redistricting Commission
New York’s commission was created by a 2014 voter-approved constitutional amendment to reform the redistricting process. The bipartisan commission of ten proposes congressional and state legislative maps, which are then submitted to the state legislature for approval or modification. Though the legislature ultimately retains final authority over district maps. For more information see the page below.
2020-the present
Polarization and Technology have allowed for highly effective gerrymanders, however increasing awareness of it has led certain states like New York to condemn the practice and create independent commissions to draw maps while other states embrace mid-decade redistricting due to the shifting political environment.
New Public Data and Awareness
As of fairly recently, geographic partisan data analytics became much more widely available to the public through platforms such as Dave’s Redistricting which can show election results down to the precinct level and allow for public mapmaking. Public tools allow for more engagement in redistricting and can facilitate better input for IRCs across the nation.
Discover the History of New York Districts
An in-depth timeline showcasing pivotal changes in New York’s congressional districts and their impact on representation.

Early District Formation
Examine the origins of New York’s district boundaries and the early frameworks of representation.
Mid-Century Redistricting
Understand the key legislative shifts and demographic changes influencing district maps in the 20th century.
Modern Redistricting Efforts
Review recent reforms and advocacy aimed at promoting fairness in New York’s electoral districts.
Future of Fair Maps
Discover ongoing initiatives and strategies advancing transparency and equity in redistricting.
District History Overview
Discover the detailed timeline of New York’s district evolution and House representation, providing key insights into historical shifts and their impact on current redistricting efforts.

Phase One: Early Foundations
Examine the origins of New York’s congressional districts, tracing the establishment of boundaries and legislative developments that shaped initial representation.

Phase Two: Mid-Century Changes
Understand the significant redistricting changes during the mid-1900s, including political, demographic, and legal influences affecting district realignment.

Phase Three: Modern Redistricting
Review recent developments and reforms in district mapping, emphasizing efforts to promote fairness and transparency in the redistricting process.